

2025 © ALL RIGHTS RESERVED. All content, images, and materials published herein are the sole property of Upscale BI and are protected under applicable copyright laws. Unauthorized reproduction, distribution, or use is strictly prohibited.

Page 1 – Session Trends and Insights

Page 2 – Revenue Insights

Page 3 – Client Insights

Page 4 – Employee Insights
The Wellness Center Performance Insights Dashboard is a game-changer for wellness businesses aiming to thrive in today’s dynamic market. This dashboard empowers wellness leaders with insights into client trends, revenue performance, and operational efficiency. By leveraging this tool, wellness centers can uncover growth opportunities, enhance customer satisfaction, and streamline decision-making in one seamless platform.
Who Can Benefit From This Dashboard?
This dashboard is tailored for:
- Wellness Studios seeking to optimize client retention and session performance.
- Fitness and Rehabilitation Centers focused on increasing operational efficiency and revenue streams.
- Yoga and Pilates Studios tracking attendance, session trends, and service utilization.
- Therapy Clinics improving staff performance and analyzing client feedback.
- Boutique Fitness Studios targeting data-driven strategies for sustainable growth.
Why Your Wellness Business Needs This Tool
Managing a wellness center comes with challenges such as meeting client expectations, boosting team performance, and maximizing revenue. The Wellness Center Performance Insights Dashboard helps overcome these challenges by providing:
- Revenue Transparency: Identify top-performing services and track income patterns.
- Client Demographic Insights: Understand who your clients are to improve targeting and services.
- Employee Evaluation Metrics: Gauge staff productivity and customer satisfaction effectively.
- Retention Insights: Leverage data to build long-term relationships with clients.
- Operational Trends: Monitor usage patterns to make informed decisions about offerings.
This dashboard equips wellness centers with tools to turn challenges into opportunities, driving better outcomes for both the business and its clients.
Experience the Difference
Elevate your wellness business with powerful insights that inspire growth and innovation. Explore the Wellness Center Performance Insights Dashboard and see how data can empower your decisions and take your business to the next level.
Page 1: Overview Page
This page provides a high-level summary of your wellness center’s performance, offering key insights into total revenue, session counts, and client engagement metrics. It highlights essential trends in service utilization, membership status, and promotional impact, giving you a clear understanding of what drives your business and where opportunities for improvement lie.
Why You Need It
- Monitor Overall Performance: Gain a snapshot of your wellness center’s health with essential KPIs such as total revenue and session trends.
- Identify Service Trends: Discover which services and sessions are most utilized to optimize your offerings.
- Evaluate Membership Impact: Compare revenue and session participation between members and non-members to refine your retention strategy.
- Assess Promotional Effectiveness: Analyze how promo codes and campaigns influence client behavior and revenue.
- Make Informed Decisions: Leverage key metrics to identify areas of growth and align your strategy with business objectives.
This page is ideal for wellness center managers who need a quick yet detailed overview to stay informed and make smarter decisions for their business.

Visual: Key Performance Indicators (KPIs)
This visual provides an overview of critical metrics like total sessions, daily trends, and the most in-demand services to monitor wellness center activity.
Benefits:
- Track Business Growth: Monitor total sessions over time to assess activity levels and growth.
- Optimise Operations: Use daily session trends to allocate resources and schedule staff efficiently.
- Identify Client Preferences: Recognise the most popular services to prioritise marketing and resource allocation.
- Stay Informed: Access a concise snapshot of operational performance for proactive decision-making.
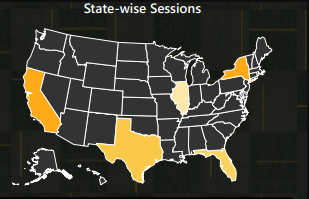
Visual: State-wise Sessions
This map showcases session distribution across states, revealing geographic performance trends and areas for strategic focus.
Benefits:
- Focus on High Demand: Allocate resources to states with the highest session counts to capitalise on client demand.
- Expand Strategically: Identify underperforming regions and explore opportunities for growth or targeted marketing.
- Tailor Services: Align offerings with regional preferences to improve client satisfaction and engagement.
- Inform Scaling Decisions: Leverage geographic insights to support plans for market expansion or optimisation.

Visual: Seasonal Session Patterns
This chart highlights session trends by season, providing insights into fluctuations in client activity and service demand.
Benefits:
- Plan for Peaks: Optimize staff and resources during high-demand seasons to meet client needs efficiently.
- Boost Low Seasons: Use targeted campaigns or promotions to drive engagement during low-activity periods.
- Customize Offerings: Align services with seasonal client behavior for enhanced satisfaction and retention.
- Strategic Growth: Leverage seasonal trends for long-term operational and marketing planning.
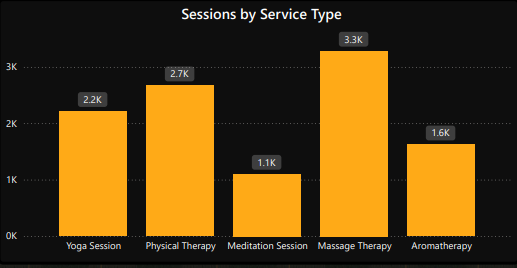
Visual: Sessions by Service Type
This visual breaks down session distribution by service type, highlighting client preferences and identifying underutilized services.
Benefits:
- Focus on Popular Services: Allocate resources effectively to high-demand services like Massage Therapy.
- Promote Underutilized Offerings: Implement campaigns to increase engagement with lower-demand services, such as Meditation Sessions.
- Optimize Operations: Tailor schedules and staffing to align with service popularity.
- Refine Offerings: Use insights to expand or adjust services to better meet client needs and boost satisfaction.

Visual: Session Trends Over Time
This visual tracks daily session trends throughout the year, highlighting activity fluctuations and seasonal client behaviours.
Benefits:
- Daily Engagement Insights: Identify spikes and dips in daily session counts for better operational planning.
- Seasonal Patterns: Detect recurring high-demand periods to optimise staff and resource allocation.
- Strategic Marketing: Target slow periods with promotions to boost engagement.
- Long-Term Planning: Leverage insights for improved service scheduling and enhanced client retention strategies.
Benefits of the Filters
- Allows segmentation of data to analyze session trends and revenue differences between members and non-members.
- Helps in understanding the effectiveness of membership programs and identifying potential retention strategies.
Location
- Enables geographic analysis by filtering data for specific states (e.g., California, Florida).
- Helps identify high-performing and underperforming regions to optimize marketing and resource allocation.
Year, Month
- Provides the ability to analyze trends over specific timeframes, such as monthly, yearly, or seasonal patterns.
- Useful for comparing performance year-over-year or assessing the impact of promotional campaigns during specific months.
Service Type
- Allows detailed analysis of session trends for different services (e.g., Aromatherapy, Massage Therapy).
- Helps identify the most and least popular services, enabling better resource planning and promotional focus.
Why These Filters Matter
- Enhance decision-making by narrowing down data to relevant categories.
- Provide flexibility to analyze trends and performance based on specific business needs.
- Support targeted strategies for marketing, resource allocation, and client retention.
- Enable wellness centers to dive deeper into client preferences, regional trends, and seasonal demand.
These filters empower wellness centers to extract actionable insights tailored to their operational goals.
Page 2: Revenue Insights
This page dives deep into the revenue performance of the wellness center, offering detailed insights into income streams, promotional effectiveness, and service-based contributions. It provides a clear understanding of the financial health of the business and highlights areas for optimization to maximize profitability.
Why You Need It
- Track Revenue Sources: Identify which revenue streams—class fees, merchandise, or add-ons—contribute the most to your bottom line.
- Analyze Promotional Impact: Evaluate how effectively promo codes and campaigns drive revenue growth and client engagement.
- Understand Service Contributions: Break down revenue by service type to identify high-performing and underutilized offerings.
- Identify Revenue Trends: Monitor income patterns over time to spot peak periods and address slowdowns proactively.
- Enhance Financial Planning: Use data-driven insights to make informed decisions about pricing, promotions, and service investments.
This page is essential for wellness center owners and managers aiming to boost profitability, optimize service offerings, and create a sustainable financial strategy.

Visual: Revenue KPIs
This visual offers a snapshot of key revenue metrics, tracking overall financial performance and member contributions.
Benefits:
- Track Financial Health: Monitor total revenue for a high-level overview of business performance.
- Evaluate Membership Impact: Assess how much revenue is driven by loyal members versus non-members.
- Analyse Revenue Balance: Understand the contributions of walk-in clients to refine outreach and engagement strategies.
- Optimise Session Value: Use the average revenue per session to evaluate pricing strategies and service value.

Visual: Revenue Breakdown by Service Type
This visual showcases the revenue contributions of various services, helping wellness centres optimise their offerings.
Benefits:
- Focus on High Performers: Prioritise investment and marketing for top revenue-generating services like Aromatherapy and Physical Therapy.
- Boost Underperformers: Identify services with lower revenue, such as Meditation Sessions, and improve through targeted promotions or adjustments.
- Understand Client Preferences: Gain insights into client demand to align services with market needs.
- Strategic Growth: Use financial performance data to refine service offerings and drive sustainable revenue growth.

Visual: Revenue by Promotional Code Used
This visual analyses revenue from sessions with and without promotional codes, offering insights into the effectiveness of promotional campaigns.
Benefits:
- Measure Promotional Success: Identify the significant revenue contribution (55.06%) from sessions with promotional codes, showing their role in driving bookings.
- Evaluate Baseline Revenue: Understand revenue generated without discounts to assess standard pricing’s effectiveness.
- Enhance Client Engagement: Gain insights into how promotions influence client behavior and increase session participation.
- Optimise Marketing Strategy: Refine promotional campaigns to balance profitability and client acquisition, ensuring a strong return on investment (ROI).

Visual: State-wise Revenue
This visual provides an analysis of revenue distribution across various states, highlighting geographic performance trends.
Benefits:
- Target High-Performing Regions: Focus on states like California and Texas, which lead in revenue generation, to amplify growth and allocate resources effectively.
- Boost Low-Revenue Areas: Identify regions with lower revenue contributions and implement tailored marketing campaigns or services to increase engagement.
- Understand Regional Demand: Gain insights into state-specific preferences to customise offerings and promotions for optimal resonance with local clients.
- Strategic Resource Planning: Align staffing, marketing, and operations with regional revenue trends to ensure efficient resource utilisation and maximise returns.
This visual helps wellness centers identify geographic opportunities for growth and refine their strategies to enhance overall revenue performance.

Visual: Revenue Trends Over Time
This visual provides a year-long view of daily revenue trends, offering critical insights into financial performance patterns.
Benefits:
- Monitor Daily Revenue Patterns: Gain a detailed understanding of how revenue varies daily, helping to fine-tune short-term strategies.
- Leverage Seasonal Trends: Identify periods of high and low revenue, such as peaks during holidays or dips in off-seasons, to plan resources and campaigns effectively.
- Track Revenue Growth: Recognize trends of consistent revenue growth or decline, enabling early intervention to address potential issues.
- Measure Promotional Impact: Assess the effectiveness of marketing efforts by analyzing revenue spikes following promotions or events.
This visual helps wellness centers align operations with revenue patterns, ensuring a proactive approach to maximizing profitability and sustaining financial health.
Filters for Page 2
Promo Campaign
- Purpose: Filter revenue data based on specific promotional campaigns.
- Benefits:
- Evaluate the financial impact of individual promotions (e.g., Black Friday Deal, Holiday Cheer).
- Identify which campaigns generate the highest revenue to refine future marketing strategies.
- Analyze client behavior during promotional periods.
Location
- Purpose: Filter revenue data by state.
- Benefits:
- Analyze state-wise revenue contributions to identify top-performing regions.
- Compare regional trends to allocate resources and prioritize marketing efforts.
- Tailor services and campaigns based on geographic performance.
Year, Month
- Purpose: Filter revenue trends by specific years and months.
- Benefits:
- Monitor year-over-year and month-over-month revenue performance.
- Detect seasonal revenue spikes or declines.
- Analyze the impact of long-term growth strategies or short-term campaigns.
Service Type
- Purpose: Filter revenue by specific services offered.
- Benefits:
- Identify which services contribute the most or least to overall revenue.
- Focus on high-revenue services for optimization and investment.
- Understand service preferences to guide promotions and service enhancements.
Why These Filters Matter
- Allow decision-makers to narrow down data for specific business queries.
- Provide flexibility to analyze revenue trends based on campaigns, regions, timeframes, and services.
- Support data-driven decisions for resource allocation, service improvement, and campaign planning.
- Enhance the dashboard’s usability by enabling detailed, customized insights.
These filters empower wellness center managers to dive deeper into revenue data, uncover trends, and implement effective strategies for sustained financial growth. Let me know if you’d like to proceed with the next page!
Page 3: Client Insights
This page provides a detailed analysis of client demographics, health conditions, and referral sources, offering valuable insights into the wellness center’s client base. By understanding who the clients are and what drives their engagement, wellness centers can tailor services, improve retention, and enhance overall client satisfaction.
Why You Need It
- Understand Client Demographics: Gain insights into client age, gender, and membership status to tailor services and promotions effectively.
- Analyze Health Conditions: Identify the primary reasons clients seek wellness services, helping prioritize services that align with client needs.
- Track Referral Sources: Understand how clients are discovering your services—whether through social media, friends, or online searches—to optimize marketing efforts.
- Assess Client Loyalty: Explore how membership status influences client engagement and session frequency.
- Support Targeted Growth: Use demographic and referral data to expand services and marketing efforts in alignment with client preferences.
This page is essential for wellness center managers aiming to strengthen client relationships, enhance service offerings, and drive targeted marketing strategies.

Visual: Client Demographics Overview
This visual provides a summary of client demographics, highlighting gender distribution, total unique clients, and average client age.
Benefits:
- Tailor Services & Promotions: Customize offerings and marketing strategies based on gender and age distribution to better meet client needs.
- Enhance Client Retention: Track total unique clients to assess engagement and improve retention strategies.
- Targeted Campaigns: Create effective, age-specific campaigns that resonate with key demographic groups, boosting acquisition and loyalty.
This visual helps wellness centres optimize client engagement and marketing efforts by aligning strategies with demographic insights.

Visual: Revenue by Gender
This visual shows the revenue contribution from clients categorized by gender, revealing key insights into spending patterns.
Benefits:
- Prioritize High-Contributing Groups: Focus marketing and service offerings on the gender group that generates the most revenue.
- Identify Growth Opportunities: Assess revenue potential from male and other gender groups to uncover untapped growth areas.
- Tailor Marketing Campaigns: Design gender-specific strategies to optimize client engagement and boost overall revenue.
This visual enables wellness centres to align their services and campaigns with gender-based revenue trends for more targeted growth.

Visual: Membership Ratio
This visual displays the proportion of clients who are members versus non-members, providing insights into client loyalty and engagement.
Benefits:
- Evaluate Membership Success: Understand the impact of your membership program, with members making up 69.7% of the client base.
- Growth Opportunities: Pinpoint potential to convert non-members into members to increase retention and long-term revenue.
- Refine Enrollment Strategies: Use insights to design more effective strategies for boosting membership enrollment.
This visual helps wellness centres assess membership success and identify opportunities to drive membership growth.

Visual: Age Distribution of Clients
This visual displays the distribution of clients across different age groups, offering insights into your client demographics.
Benefits:
- Client Demographics: Identify the predominant age groups in your client base to better understand your audience.
- Target Audience: Tailor services and promotions based on the most engaged age ranges to increase satisfaction and loyalty.
- Age-Appropriate Offerings: Design programs that cater specifically to the age groups with the highest engagement.
This visual helps wellness centers align their services and marketing efforts with the unique needs of each client age group.

Visual: Revenue Contribution by Age Group
This visual illustrates the revenue generated by clients across different age groups, offering a breakdown of age-based revenue contributions.
Benefits:
- Top-Contributing Age Groups: Recognize that clients aged 60+ and 51-60 contribute the most to revenue, guiding prioritization of services for these groups.
- Potential Growth Areas: Identify younger age groups, like Below 20, with growth potential and target strategies to boost their engagement and revenue.
- Age-Specific Strategies: Align services and marketing efforts to maximize revenue from high-performing age groups while growing underperforming segments.
This visual empowers wellness centers to focus on profitable age groups while driving engagement across all client demographics.

Visual: Top Referral Sources
This visual showcases the primary channels through which clients are referred to the wellness center, highlighting the most effective and underperforming sources.
Benefits:
- Dominant Referral Channels: Recognize that Online Search leads with 19.8K clients, allowing you to focus on strengthening this channel.
- Underperforming Channels: Identify social media as a lagging source and capitalize on strategies to boost its performance.
- Optimized Marketing Efforts: Prioritize resources for the most successful referral channels while refining others for better client acquisition.
This visual enables wellness centers to fine-tune their client acquisition strategies, focusing on high-performing channels while improving underutilized ones.

Visual: Health Conditions of Clients
This visual displays the health conditions clients seek services for, segmented by their referral sources, providing insight into client needs and how they connect to specific channels.
Benefits:
- Common Health Concerns: Identify that General Wellness and Stress are the most common reasons for visits, guiding focus on these areas.
- Referral Source Impact: Understand how Social Media referrals often correlate with clients seeking Stress-related services, allowing targeted campaigns.
- Opportunity Areas: Spot moderate engagement with Chronic Pain and Injury Recovery, creating opportunities to enhance services or promotions for these conditions.
This visual helps wellness centers refine their services and marketing strategies to better address the health concerns of their clients, leading to more effective client engagement.
Filters for Page 3: Client Insights
Age
- Purpose: Allows filtering client data based on specific age ranges.
- Benefits:
- Analyze age-specific trends to tailor services for different demographics.
- Identify which age groups are most engaged and contribute the most revenue.
Membership Status
- Purpose: Separates data for members and non-members.
- Benefits:
- Compare client engagement and revenue contributions between members and non-members.
- Evaluate the effectiveness of membership programs in retaining clients.
Gender
- Purpose: Filters client data by gender categories.
- Benefits:
- Understand gender-specific trends to design targeted services or promotions.
- Analyze revenue contributions and session participation by gender.
Referral Source
- Purpose: Focuses data on specific referral channels.
- Benefits:
- Evaluate the performance of referral sources like Social Media or Friends.
- Identify which channels drive the most engagement and revenue across different client demographics.
Why These Filters Matter
- These filters enhance the dashboard’s usability by providing the flexibility to dive deeper into client trends.
- They allow decision-makers to focus on specific demographics or referral channels, enabling more targeted insights.
- Supports data-driven strategies for client retention, marketing, and service improvement.
Let me know if you’d like to proceed with the next page!
Page 4: Employee Insights
This page focuses on the performance and impact of employees on the wellness center’s success. It provides detailed insights into employee contributions, client feedback, and session management, helping managers evaluate performance and identify opportunities for improvement.
Why You Need It
- Evaluate Employee Performance: Gain a clear understanding of how each employee contributes to revenue and client satisfaction.
- Monitor Session Distribution: Analyze how sessions are distributed among employees to ensure balanced workloads and identify top performers.
- Assess Feedback Scores: Use client feedback to evaluate the quality of services provided by employees.
- Optimize Resource Allocation: Identify high-performing employees to leverage their strengths and assist those who need improvement.
- Boost Employee Engagement: Provide data-driven insights to encourage and motivate employees by recognizing top contributors.
This page is essential for wellness center managers to ensure that employee performance aligns with business goals and to foster a productive and motivated team.

Visual: Employee Performance KPIs
This visual provides a high-level summary of key employee performance metrics, helping assess individual and team contributions to wellness center success.
Benefits:
- Top Performer (Revenue): Identify the employee generating the most revenue, allowing for recognition and reward of their efforts.
- Average Feedback Score: Measure client satisfaction with an overall average feedback score, providing insights into service quality.
- Total Clients Handled: Track the number of clients managed by employees, highlighting team workload and service engagement.
This visual supports decision-making in optimizing team performance, recognizing top employees, and ensuring client satisfaction.

Visual: Feedback Score by Total Clients
This visual displays the distribution of client feedback scores across all sessions, offering insights into service quality and client satisfaction.
Benefits:
- High Satisfaction (Scores 4-5): Understand which percentage of clients provided positive feedback, emphasizing areas where services are excelling.
- Areas for Improvement (Scores 1-3): Identify clients who gave lower scores, pinpointing areas for service enhancements.
This visual helps wellness centers enhance service quality by addressing client concerns and maintaining high satisfaction levels.

Visual: Average Feedback Score by Employee
This visual provides an evaluation of individual employee performance by displaying the average feedback score each employee receives.
Benefits:
- High Performers: Recognize employees with consistently high scores, highlighting those who excel in client satisfaction.
- Improvement Areas: Identify employees with lower scores, signaling opportunities for targeted training or support.
- Performance Variability: Assess the consistency of service across the team, ensuring a high standard of client experiences.
This visual empowers wellness centers to support employee growth, celebrate top performers, and maintain consistent service quality.

Visual: Sessions by Employee
This visual shows the number of sessions each employee handles, helping assess individual workloads and contributions.
Benefits:
- High Workload Employees: Recognize employees managing the most sessions, highlighting their productivity and potential for recognition.
- Balanced Distribution: Ensure fair session distribution across the team to maintain a healthy work-life balance and prevent burnout.
- Underutilized Employees: Identify employees with fewer sessions, offering opportunities for reallocation or additional training to boost performance.
This visual enables wellness centers to optimize session distribution, prevent burnout, and support employee development for a more efficient team.

Visual: Revenue by Employee
This visual displays the revenue generated by each employee, helping assess their individual impact on the wellness center’s financial performance.
Benefits:
- Top Revenue Generators: Identify employees who contribute significantly to revenue, allowing for recognition and rewards.
- Performance Variability: Spot differences in revenue contributions to uncover patterns or areas needing improvement.
- Opportunities for Growth: Highlight employees with lower revenue, providing targeted development strategies or additional support.
This visual enables wellness centers to optimize employee performance and align resources with business goals for enhanced revenue generation.
Filters for Page 4: Employee Insights
Feedback Score
- Purpose: Filters data based on client feedback scores for employee sessions.
- Benefits:
- Identify employees with consistently high or low feedback scores.
- Analyze client satisfaction trends across specific feedback ranges.
- Enable focused improvement for employees receiving lower scores.
Employee
- Purpose: Allows filtering data for specific employees.
- Benefits:
- Focus on individual employee performance metrics.
- Evaluate contributions, sessions, and revenue for specific team members.
- Supports targeted development and recognition initiatives.
Year, Month
- Purpose: Filters data by specific timeframes.
- Benefits:
- Analyze employee performance trends over different years or months.
- Compare yearly or monthly contributions for targeted planning.
- Identify seasonal variations in employee workload or revenue contributions.
Why These Filters Matter
- Provide granular control to analyze employee performance, feedback, and contributions in detail.
- Enable better planning, resource allocation, and targeted performance management.
- Support wellness center managers in making data-driven decisions to optimize team effectiveness and client satisfaction.

