

2025 © ALL RIGHTS RESERVED. All content, images, and materials published herein are the sole property of Upscale BI and are protected under applicable copyright laws. Unauthorized reproduction, distribution, or use is strictly prohibited.

Page 1 – Overview Page

Page 2 – Class Performance
Page 3 – Customer Analytics

Page 4 – Instructor Performance
Upscale BI’s Boutique Fitness Insights Dashboard is the ultimate tool for boutique fitness studios looking to thrive in today’s competitive market. With its ability to analyze class performance, customer demographics, and revenue streams, this dashboard provides studio owners with the insights they need to optimize operations, enhance client satisfaction, and boost profitability—all in one intuitive platform.
Who Can Revolutionize Their Business With This?
This dashboard is a transformative tool for:
- Boutique Fitness Studios seeking to enhance client engagement and maximize revenue.
- Yoga and Pilates Centers focusing on attendance trends and session performance.
- Cycling and Spin Studios optimizing scheduling and peak class hours.
- Functional Training Facilities improving efficiency through data-driven decisions.
- Wellness Studios and Recovery Centers targeting higher satisfaction and retention rates.
Why Your Boutique Fitness Studio Needs This
Running a boutique fitness studio comes with unique challenges like balancing class performance, boosting revenue, and retaining clients. The Boutique Fitness Insights Dashboard simplifies these complexities by delivering:
- Revenue Clarity to uncover which classes and revenue streams are driving growth.
- Class Performance Metrics to evaluate and enhance top-performing sessions.
- Client Demographic Insights to better tailor your offerings to your audience.
- Retention Strategies to identify and address potential churn risks early.
- Growth Analytics to track and visualize your studio’s performance over time.
With Upscale BI’s dashboard, boutique fitness studios don’t just see data—they use it to drive smarter decisions, strengthen client relationships, and achieve long-term success.
See the Impact for Yourself
Transform your boutique fitness studio with actionable insights and measurable results. Dive into the Boutique Fitness Insights Dashboard by Upscale BI today and see how data can elevate your business to new heights!
Page 1: Overview Page
This page provides a snapshot of your boutique fitness studio’s key metrics, including total revenue, attendance figures, and retention rates. It highlights top-performing classes and analyzes trends in customer demographics and revenue sources, helping you understand where your business thrives and where opportunities lie.
Why You Need It
- Stay on Top of Your Performance: Quickly assess your studio’s overall health with key performance indicators.
- Understand Revenue Drivers: Identify which revenue streams, such as class fees or add-on sales, contribute the most to your bottom line.
- Spot Demographic Insights: See attendance trends by age group to better tailor your services.
- Make Data-Driven Decisions: Use detailed revenue and attendance trends to align strategies with client demand.
Ideal for boutique fitness studio owners who need clear, actionable insights to enhance operational efficiency and drive growth.

Visual: Boutique Fitness Metrics at a Glance
This visual provides a concise summary of essential performance metrics, giving boutique fitness centres a clear overview of their business health.
Benefits:
- Quick Performance Overview: Gain an at-a-glance understanding of key metrics like Total Revenue, Total Attendance, Retention Rate, and the Top Class by Revenue.
- Revenue Insights: Identify overall income sources from memberships, class fees, and additional services to assess financial health.
- Customer Engagement: Track Total Attendance to evaluate how actively clients engage with the center’s offerings.
- Retention Monitoring: Understand customer loyalty and satisfaction through Retention Rate trends.
- Top Class Identification: Highlight profitable offerings, such as Boxing Basics, to prioritize promotions and optimize resource allocation.
- Actionable Insights: Equip stakeholders with clear, actionable data to maintain financial stability and tailor services to customer preferences.

Visual: Revenue Distribution by Source
This visual showcases how revenue is distributed across key streams—Class Fees, Merchandise, and Add-On Sales—offering a detailed look at their financial contributions.
Benefits:
- Identify Dominant Revenue Streams: Class Fees drive the majority of revenue (69.04%), helping centers prioritize their core offerings.
- Spot Growth Opportunities: Merchandise (21.18%) and Add-On Sales (9.78%) present areas for targeted growth through promotions and new product strategies.
- Optimize Profitability: Use insights to adjust pricing, marketing efforts, and product offerings for maximized income.
- Diversify Income Streams: Balance revenue sources to reduce reliance on any single stream, ensuring financial stability.
- Drive Strategic Focus: Enable boutique fitness centers to allocate resources effectively to high-impact areas.

Visual: Attendance Breakdown by Age Group
This visual breaks down class attendance by age group, offering insights into the demographics driving participation and uncovering growth opportunities.
Benefits:
- Focus on Most Engaged Groups: Identify the 18-25 age group as the most active demographic, allowing studios to prioritize this segment for engagement and retention strategies.
- Recognize Steady Contributors: Leverage the consistent participation of the 26-35 and 36-50 age groups to sustain attendance through tailored retention efforts.
- Tap into Underserved Audiences: Target <18 and 50+ demographics with customized programs or promotions to boost their engagement.
- Optimize Class Offerings: Use insights to schedule classes and services that align with the preferences of different age brackets.
- Enhance Marketing Strategies: Develop age-specific campaigns to attract and retain members across diverse demographics.

Visual: Revenue Trends Over Time
This visual illustrates monthly revenue changes, helping fitness studios monitor financial performance, pinpoint peak periods, and address low-revenue phases.
Benefits:
- Identify Revenue Peaks: Recognize months or specific days with the highest earnings to replicate successful promotions or campaigns.
- Address Revenue Dips: Spot low-revenue periods and develop strategies to improve marketing, class schedules, or offerings during those times.
- Understand Seasonal Trends: Track revenue patterns tied to seasons or events, enabling better forecasting and preparation.
- Optimize Resource Allocation: Align instructor schedules, inventory, and staffing with revenue trends to maximize operational efficiency.
- Support Strategic Planning: Use insights to understand the factors influencing revenue changes, such as holidays, member behavior, or special promotions.
Filters to Drive Better Decisions:
- Year: Select from 2019 to 2023 to track trends and performance, providing a clear view of long-term growth.
- Month Name: Focus on specific months to identify seasonal patterns that can inform strategic planning.
- Class Type: Filter by individual class types (e.g., HIIT, Barre Sculpt, Indoor Cycling) to pinpoint top-performing classes and maximize their potential.
How It Helps:
These filters empower boutique fitness studio owners to make data-driven decisions by identifying growth opportunities, optimizing schedules, and refining marketing strategies.
If you’d like to add Membership Type in the future, we can revisit and adjust!
Page 2: Class Performance
This page focuses on the performance of each class type offered by your boutique fitness studio. It showcases revenue, attendance, and weekly trends, allowing you to identify top-performing classes, optimize schedules, and make informed decisions about class offerings. By diving into instructor contributions and occupancy rates, this page provides a clear picture of how individual classes impact your studio’s success.
Why You Need It:
- Evaluate Class Revenue: Identify which classes generate the highest revenue and prioritize them in your offerings.
- Track Attendance Trends: Analyze weekly attendance to schedule classes effectively and maximize participation.
- Monitor Instructor Performance: Compare instructors’ contributions to revenue, attendance, and occupancy rates for better resource allocation.
- Optimize Class Scheduling: Use occupancy and no-show data to adjust class times and improve customer satisfaction.
Ideal for studio owners and managers looking to maximize revenue, improve class efficiency, and enhance member experience through data-driven planning and decision-making.

Visual: Total Revenue by Class Type
This visual shows the revenue generated by each class type, enabling boutique fitness studios to identify their most profitable offerings and focus efforts where they matter most.
Benefits:
- Identify Revenue Drivers: Pinpoint which classes, such as HIIT or Barre Sculpt, contribute the most to overall revenue.
- Compare Financial Performance: Evaluate the revenue impact of different class types to guide strategic decision-making.
- Optimize Scheduling: Prioritize popular and high-revenue classes in your timetable to maximize profitability.
- Targeted Promotions: Allocate marketing resources to boost attendance in high-performing classes or promote underperforming ones.
- Enhance Member Satisfaction: Focus on classes that align with member preferences, ensuring loyalty and consistent engagement.
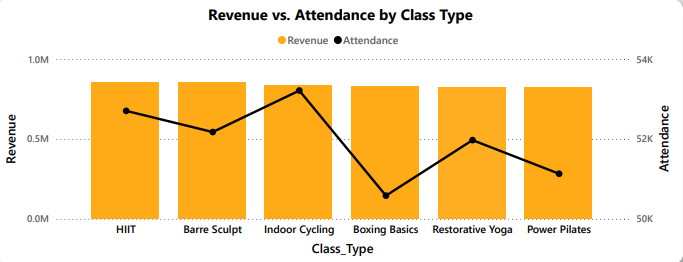
Visual: Revenue vs. Attendance by Class Type
This visual compares revenue and attendance across class types, helping fitness studios balance popularity and profitability for each offering.
Benefits:
- Assess Revenue-Attendance Dynamics: Identify the relationship between how many members attend a class and the revenue it generates.
- Spot High-Value Classes: Highlight classes like Indoor Cycling that excel in both attendance and revenue, or outliers like Restorative Yoga that yield strong revenue despite fewer attendees.
- Uncover Pricing Opportunities: For classes with high attendance but lower revenue, consider pricing adjustments or upselling opportunities to boost earnings.
- Strategic Scheduling: Allocate peak time slots to classes that are both popular and financially impactful.
- Enhance Overall Performance: Strike a balance between engaging members with popular classes and optimizing profitability through targeted improvements.

Visual: Weekly Attendance by Class Type
This table shows the weekly attendance for each class type, giving fitness studios a clear view of participation trends and total attendance over the week.
Benefits:
- Track Weekly Patterns: See how attendance varies across different class types, such as Power Pilates or HIIT, to identify trends over the week.
- Identify Popular Classes: Pinpoint classes like Indoor Cycling that consistently draw the largest crowds, ensuring they remain a priority in your schedule.
- Plan Resources Effectively: Use attendance data to ensure sufficient staffing, equipment, and space for high-demand classes, improving the overall member experience.
- Optimize Class Schedules: Adjust time slots for less attended classes or add extra sessions for popular ones to meet member demand and increase attendance.
- Maximize Member Engagement: Tailor class offerings to align with participation patterns, ensuring members stay engaged and satisfied throughout the week.

Visual: Class Performance Summary
This table provides a detailed overview of each class’s performance metrics, including attendance, revenue, occupancy rates, and no-show percentages, allowing fitness studios to track and optimize class performance.
Benefit:
- Spot Top-Performing Classes: Identify which classes like Barre Sculpt or HIIT contribute the most to revenue and attendance, helping you prioritize these offerings.
- Evaluate Instructor Impact: Understand how instructors affect the performance of each class, aiding in the alignment of skilled instructors with popular or high-revenue classes.
- Optimize Class Occupancy: Measure occupancy rates to ensure class spaces are being used efficiently, potentially adjusting class sizes or adding sessions based on demand.
- Analyze No-Show Trends: Track no-show rates and identify opportunities to reduce cancellations through strategies such as reminders or member incentives to improve attendance.
- Enhance Resource Allocation: Use insights to allocate instructors and resources where they will have the most impact, maximizing both engagement and revenue.
- Implement Data-Driven Strategies: Leverage these performance metrics to refine scheduling, enhance member experience, and optimize profitability.
Filters to Explore Your Data:
- Year: Analyze trends from 2019 to 2023 to track year-over-year performance and progress.
- Month Name: Uncover seasonal trends by drilling into specific months to optimize class scheduling and revenue strategies.
- Class Type: Evaluate metrics like attendance, revenue, and no-shows for each class type (e.g., HIIT, Barre Sculpt) to identify top performers.
- Revenue Source: Break down revenue streams (e.g., class fees, merchandise, add-ons) to understand their contributions and profitability.
- Package Type: Assess the popularity and profitability of membership packages (e.g., Single Class, Monthly Unlimited) for strategic adjustments.
How It Helps:
These filters empower fitness studio owners to:
- Focus on Priorities: Tailor dashboard insights to specific classes, time frames, or revenue streams for data-driven actions.
- Enhance Offerings: Optimize class types and membership packages based on performance.
- Boost Revenue: Identify top revenue sources and adjust promotional strategies accordingly.
- Improve Efficiency: Align class schedules and pricing with demand trends for streamlined operations.
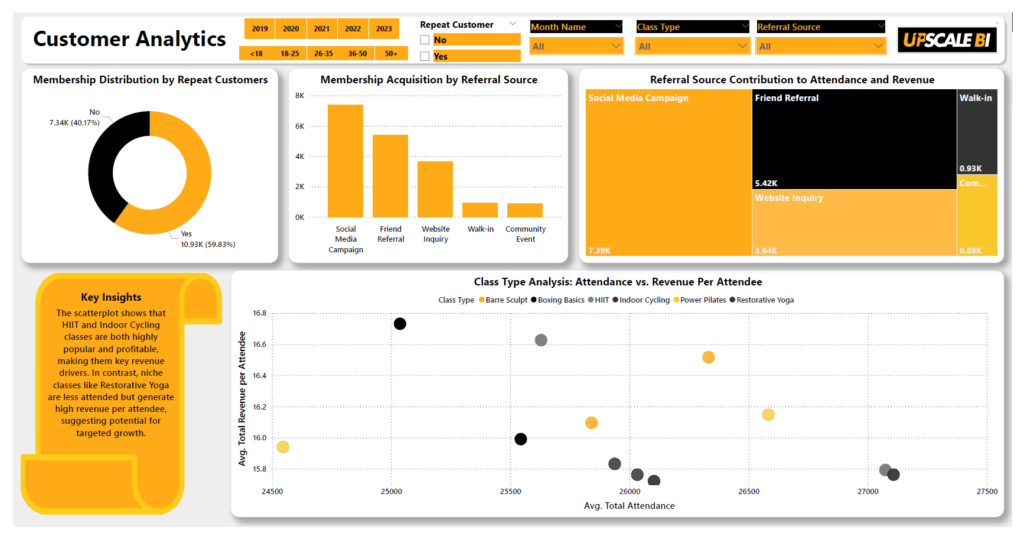
Page 3: Customer Analytics
This page delves into the behaviors and preferences of your fitness studio’s customers, providing actionable insights into referral sources, repeat customers, and revenue per attendee. It highlights critical trends to help you understand your clientele, improve retention, and optimize marketing efforts.
Why You Need It
- Understand Customer Loyalty: Identify how many of your members are repeat customers and analyze their contribution to your revenue.
- Optimize Referral Strategies: Pinpoint which referral sources drive the most attendance and revenue for targeted marketing.
- Discover Revenue Opportunities: Evaluate attendance and revenue patterns to identify high-performing customer segments.
- Drive Data-Backed Growth: Align marketing and operational strategies with customer behaviors and preferences for maximum impact.
Ideal for fitness studio owners who want to leverage customer insights to enhance retention, boost attendance, and maximize profitability.

Visual: Membership Distribution by Repeat Customers
This visual displays the ratio of repeat customers to first-time customers, helping assess loyalty and retention trends.
Benefits:
- Track Loyalty: Identify what percentage of your members are returning customers, reflecting customer satisfaction.
- Spot Opportunities: Highlight first-time customers to target with campaigns aimed at boosting retention.
- Measure Retention Success: Understand the effectiveness of your retention and loyalty programs over time.
- Boost Revenue: Focus on repeat customers who drive long-term financial growth.

Visual: Membership Acquisition by Referral Source
This bar chart shows membership acquisition across referral channels, helping identify the most effective sources for attracting members.
Benefits:
- Pinpoint Top Channels: Recognize which sources, like social media or referrals, bring in the most members.
- Improve ROI: Focus marketing efforts on the channels with the highest return on investment.
- Identify Weak Spots: Spot underperforming sources, like community events, for targeted improvements.
- Boost Growth: Use insights to amplify high-performing channels and attract more members effectively.

Visual: Referral Source Contribution to Attendance and Revenue
This tree-map provides a visual breakdown of how different referral sources contribute to both attendance and revenue, revealing their overall impact on business performance.
Benefits:
- Identify Key Contributors: Determine which referral sources, like social media or friend referrals, drive the most attendance and revenue.
- Focus on High Impact: Prioritize channels with the greatest contribution to maximize growth.
- Optimize Underperforming Sources: Target low-performing channels, such as walk-ins or community events, for improvement.
- Strategic Insights: Combine attendance and revenue data to fine-tune marketing efforts and align with business objectives.

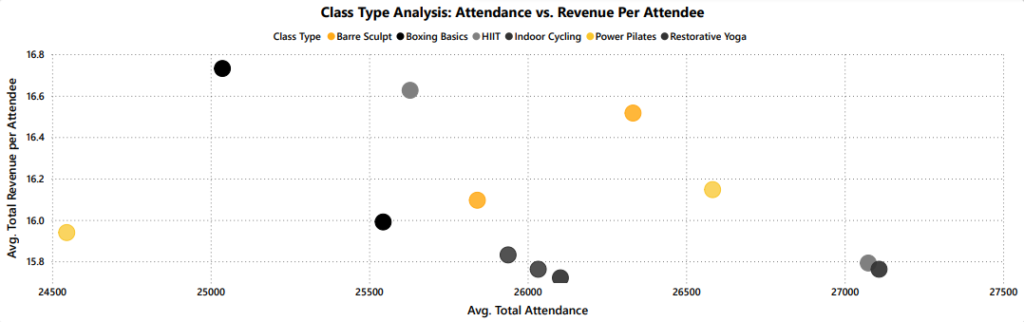
Visual: Class Type Analysis – Attendance vs. Revenue Per Attendee
This scatterplot compares average total attendance with average revenue per attendee for each class type, providing insights into key revenue drivers and areas for strategic improvement.
Benefits:
- Identify High Performers: Pinpoint classes like HIIT and Indoor Cycling that excel in both attendance and revenue per attendee, making them top contributors to overall revenue.
- Leverage Niche Opportunities: Target growth for premium classes like Restorative Yoga, which generate higher revenue per attendee despite lower attendance.
- Diversify Offerings: Balance your portfolio by analyzing contributions of various class types to attendance and revenue.
- Drive Customer-Centric Growth: Use these insights to align class offerings with customer preferences and profitability for sustainable success.
Filters to Explore Your Data:
- Year: Analyze trends from 2019 to 2023 to track year-over-year customer behavior and performance.
- Age Group: Segment customers by age groups, such as
<18,18-25,26-35,36-50, and50+, to uncover preferences across demographics. - Repeat Customer: Filter between Yes (returning clients) and No (new clients) to evaluate retention strategies and acquisition effectiveness.
- Month Name: Pinpoint seasonal trends or assess the impact of monthly campaigns by focusing on specific months.
- Class Type: Drill into individual class types to evaluate their performance and align with customer preferences and operational goals.
- Referral Source: Explore how referral sources (e.g., social media, friend referrals, walk-ins) contribute to customer acquisition and retention strategies.
How It Helps:
These filters empower fitness studio owners to:
- Understand Demographics: Analyze customer behavior across different age groups to create targeted offerings.
- Enhance Loyalty: Identify trends among repeat customers and refine retention strategies.
- Improve Campaigns: Leverage seasonal and monthly insights to optimize marketing campaigns and class scheduling.
- Boost Performance: Focus on high-performing classes and referral sources to enhance engagement and growth.
Page 4: Instructor Performance
This page provides a detailed analysis of instructor performance, focusing on revenue, attendance, and ratings. It highlights the top-performing instructors based on revenue and attendance, while offering insights into trends over time to help studio owners make informed decisions about class schedules and resource allocation.
Why You Need It:
- Identify Top Performers: Discover which instructors drive the highest revenue and attendance, ensuring you leverage their strengths effectively.
- Track Instructor Ratings: Monitor average instructor ratings over time to maintain high-quality classes and improve client satisfaction.
- Evaluate Revenue vs. Attendance: Analyze how instructor contributions align with revenue generation and attendance to optimize class scheduling.
- Support Decision-Making: Use actionable insights to allocate resources, assign classes strategically, and enhance overall studio performance.
Ideal for boutique fitness studio owners who want to optimize their instructor lineup, improve member satisfaction, and maximize revenue potential. This page helps you ensure every instructor contributes to your studio’s growth and success.

Visual: Instructor Highlights
This visual presents key performance metrics for instructors, focusing on attendance, revenue, and ratings to spotlight top contributors and improvement areas.
Benefits:
- Boost Engagement: Highlight top instructors like Liam Carter, who drives high attendance, to strengthen member engagement.
- Maximize Revenue: Leverage insights from revenue leaders like Emily Johnson to optimize high-value sessions.
- Maintain Quality Standards: Use average ratings as a benchmark to enhance overall class quality and member satisfaction.
- Inform Strategy: Analyze cumulative contributions (e.g., 5.01M total revenue) to refine growth strategies and support underperforming instructors.
This visual ensures boutique studio owners have a clear understanding of instructor impact, fostering data-driven decisions for operational excellence.

Visual: Instructor Performance by Class Type
This visual breaks down revenue contributions by instructor and class type, highlighting individual strengths and areas of excellence.
Benefits:
- Maximize Revenue: Schedule instructors like Emily Johnson for high-performing classes such as Barre Sculpt to drive profitability.
- Specialized Scheduling: Assign instructors to classes they excel at, such as Liam Carter for HIIT and Olivia Green for Restorative Yoga, to enhance member satisfaction.
- Support Growth: Identify opportunities for instructors to diversify their expertise and improve performance.
- Streamline Operations: Use balanced revenue insights across classes like Power Pilates for optimised scheduling and resource allocation.
Visual: Attendance vs. Revenue
This visual compares instructors’ total attendance and revenue, helping identify disparities and patterns that impact financial and participation performance.
Benefits:
- Enhance Value Per Attendee: Leverage Emily Johnson’s ability to generate high revenue per attendee to refine pricing or premium offerings.
- Optimize High-Attendance Classes: Develop strategies for instructors like Liam Carter to convert high attendance into higher revenue through pricing adjustments or upselling.
- Boost Low Performers: Support instructors like Olivia Green with targeted marketing, scheduling adjustments, or additional training to improve both attendance and revenue.
- Strategic Resource Allocation: Align instructor assignments with financial and engagement goals to balance member satisfaction and profitability.

Visual: Avg. Instructor Rating Over Time
This visual monitors instructor ratings over the years, highlighting trends in performance and member satisfaction to ensure consistent service quality.
Benefits:
- Ensure Consistency: Identify and maintain stable instructor ratings to provide a reliable member experience.
- Spot Key Trends: Detect periods of rating peaks or dips to assess their correlation with operational changes or feedback.
- Drive Improvement: Pinpoint low-rating periods to introduce targeted training or support for instructors.
- Boost Retention: Leverage the correlation between high ratings and member retention to foster long-term loyalty and growth.
Filters for Page 4: Instructor Performance
Filters to Explore Your Data:
- Date Range:
Use the date slider to analyze instructor performance trends over specific periods, such as quarterly or yearly. - Class Type:
Filter by class types (e.g., Yoga, HIIT, Barre Sculpt) to determine which classes drive the most revenue and attendance. - Instructor Name:
Focus on individual instructors to evaluate key performance metrics, including revenue, attendance, and average ratings.
How It Helps:
- Custom Performance Analysis:
Allows studio managers to assess instructor contributions based on specific classes or time frames. - Improved Decision-Making:
Identifies instructors excelling in particular classes, aiding in resource allocation and scheduling. - Actionable Insights for Growth:
Provides detailed performance insights to enhance instructor development, retention, and rewards.
These filters offer the flexibility to analyze individual instructor performance and refine strategies to maximize member satisfaction and revenue growth.

